The Fedena Institution Dashboard consists of a collection of dashlets that provide an overview of important institutional information for a selected date. The data displayed in each dashlet is generated from its corresponding module or page.
These dashlets help you monitor and track the overall progress of your institution. You can easily rearrange them using the drag-and-drop feature and customize the dashboard by selecting the dashlets you want to display.
Note: To access the dashlets listed below, the corresponding plugin must first be enabled in the Accounts Panel, as shown in Fig. 1. Once enabled, the plugin and its associated dashlets will be available in the respective School/College URL, as shown in Fig. 2.
FIG-1
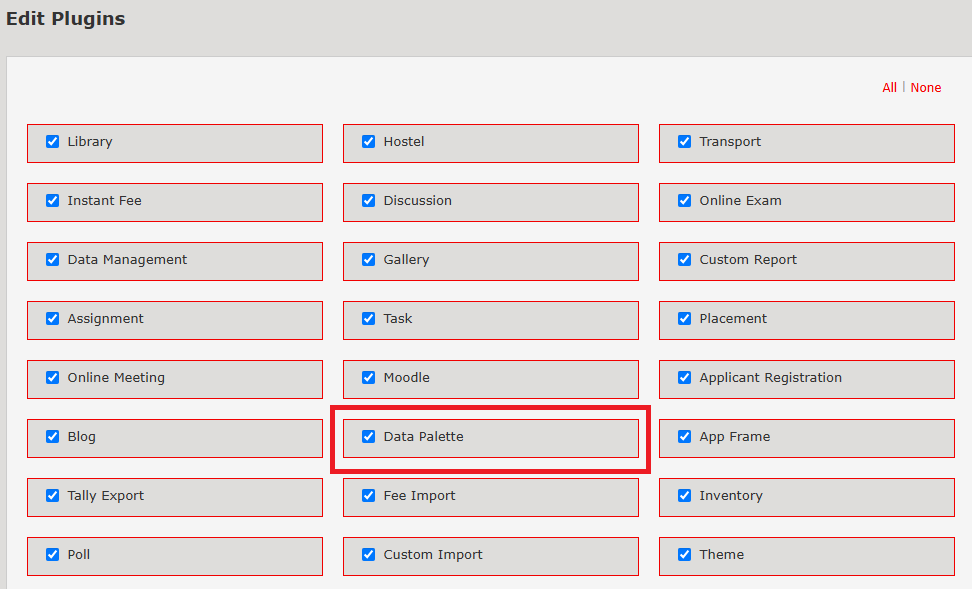
FIG-2
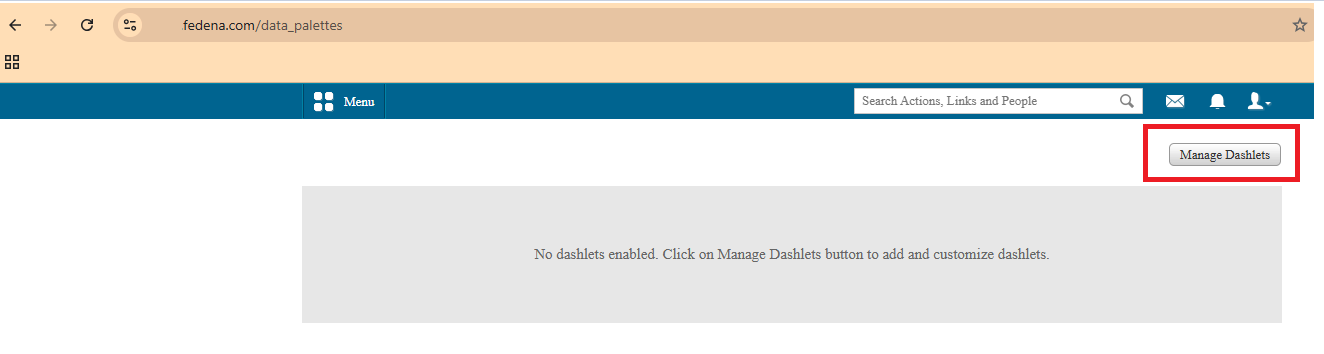
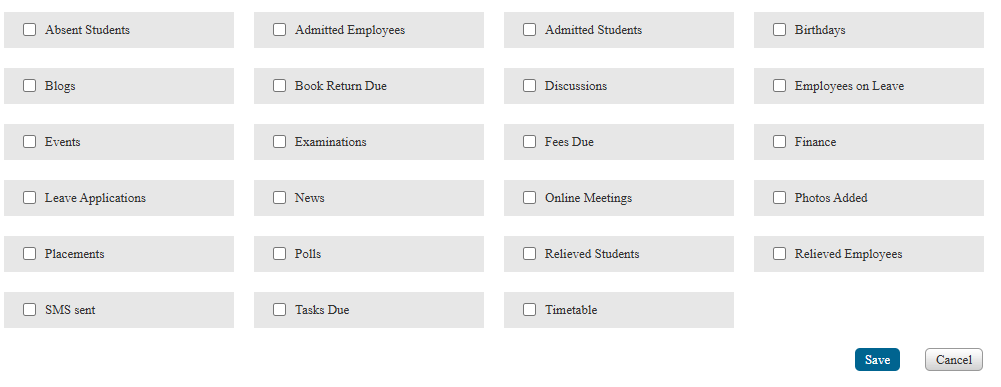
Select the modules you want to display on the dashboard, as shown in Fig. 3, and click Save.
FIG-3
Once saved, the selected modules will be displayed on the dashboard, as shown in Fig. 4.
FIG-4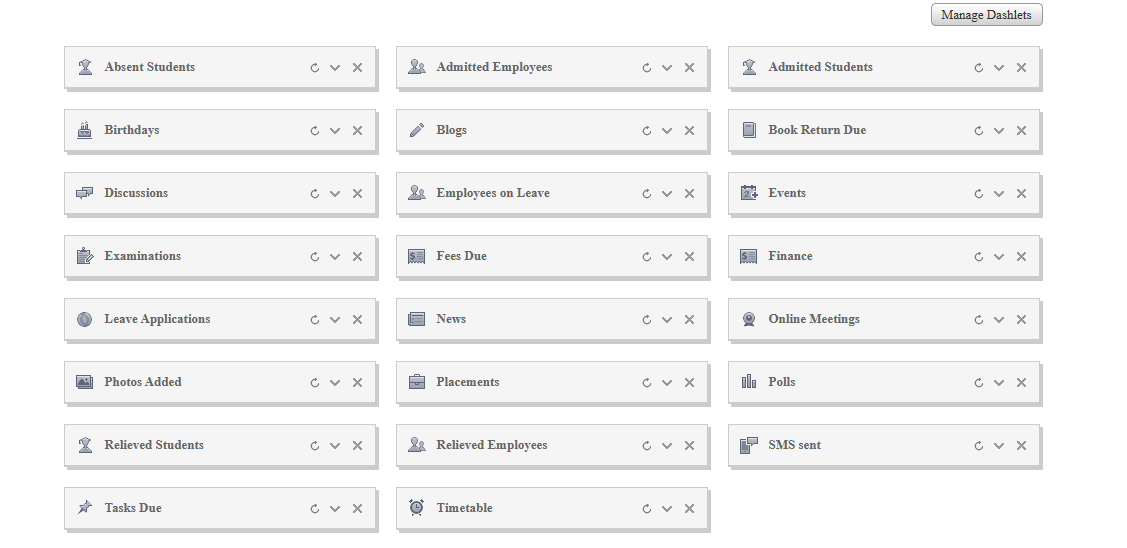 To provide a more interactive user experience, the Data Palette also contain links, so when a user clicks the link, the appropriate information is displayed based on the user’s roles and privileges allowing the user to act immediately.
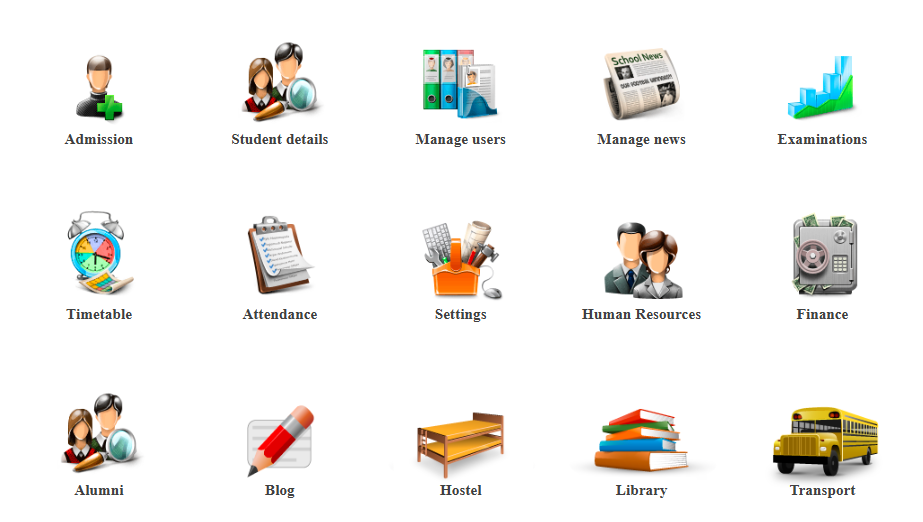
Note: If the Data Palette plugin is disabled in the Accounts Panel, the dashboard will display the screen shown in the image below.
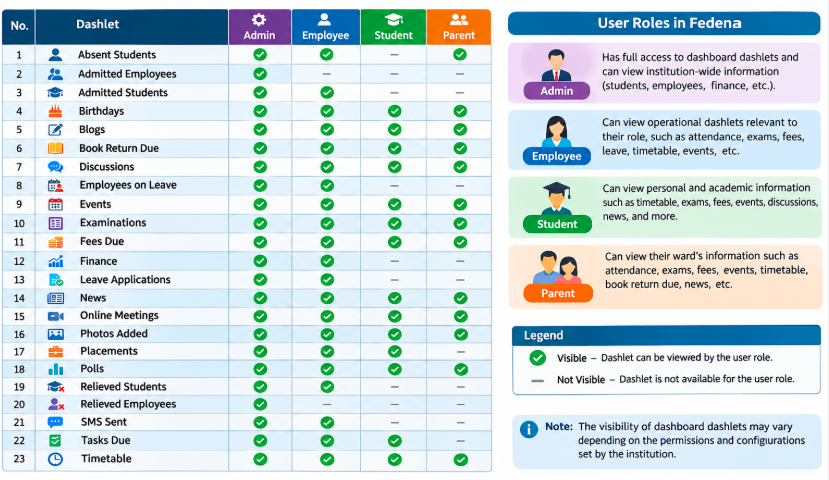
The following table describes the links available on each dashlet that can used to assess corresponding information based on user roles.
Was this article helpful?
That’s Great!
Thank you for your feedback
Sorry! We couldn't be helpful
Thank you for your feedback
Feedback sent
We appreciate your effort and will try to fix the article